





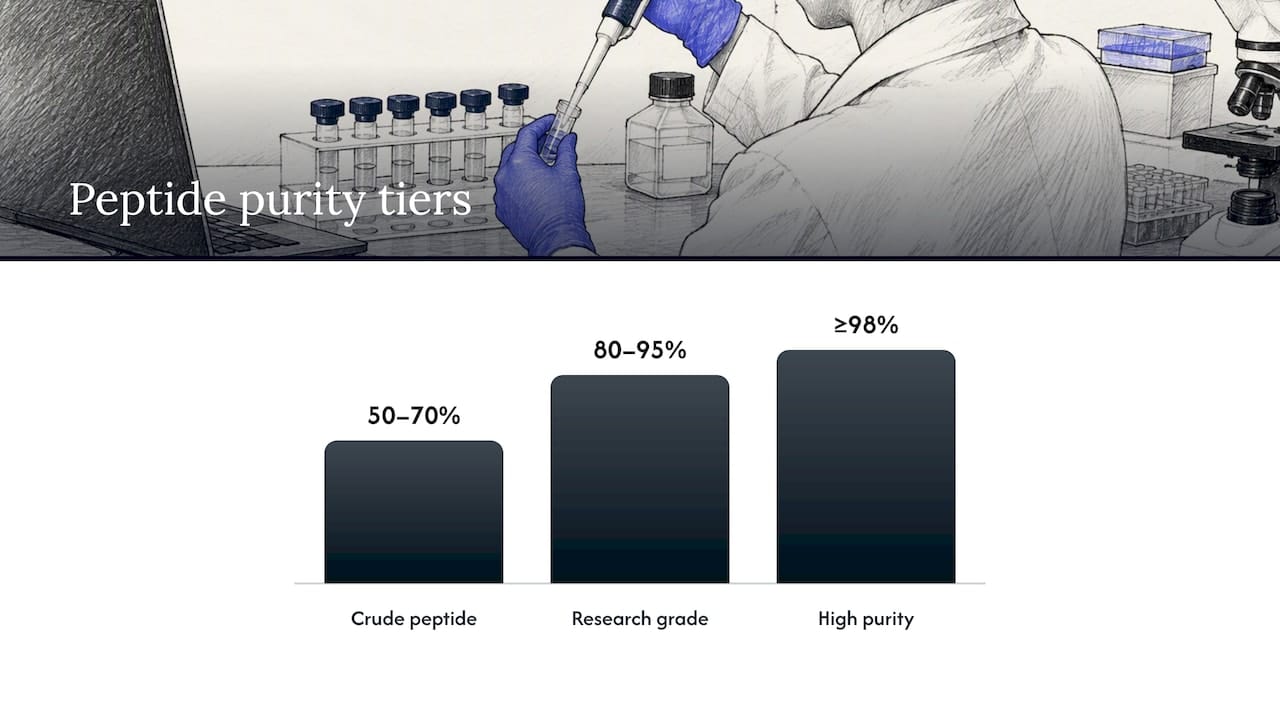
Peptide purities typically fall into tiers: crude usually falls in a lower purity range, research grade in a moderate range, and high or ultrapure material reaches the highest purity levels. The catch is that chromatographic percentages can overstate true purity, so traceable, absolute assignment depends on mass balance or other orthogonal methods. Which tier you need depends on whether you’re screening compounds, running cell assays, dosing animals, or calibrating an NMR standard.
TL;DR:
- Peptides with higher purity levels, such as 98% or above, are achievable through repeated HPLC purification, but longer sequences and additives complicate this process.
- Chromatographic purity estimates can overstate true purity, requiring mass-balance and mass spectrometry methods for accurate qualification.
- Regulatory thresholds set specific impurity reporting and qualification limits at around 0.1%, 0.5%, and 1.0%, depending on the intended use.
- Verifying only a single purity percentage is insufficient; examine raw chromatograms, MS data, and impurity content to assess actual quality.
- Early-stage screening can tolerate 80-90% purity, but in vivo or analytical standards demand the highest purity levels with comprehensive validation.
Table of Contents
- Peptide purity tiers and what they actually mean
- How peptide purity is measured: area percent, mass balance, and orthogonal methods
- Regulatory thresholds for reporting and qualifying impurities
- Reading a certificate of analysis and understanding reference standards
- Choosing purity for your experiment and verifying it quickly
- Our quality standards and the documentation we provide
- Why the purity number on the label isn’t the whole story
- Sourcing high purity peptides and what to request before you order
- FAQ
- Sources
Peptide purity tiers and what they actually mean
Suppliers generally sort peptides into three working categories. Crude peptide, straight off the synthesizer with no polishing step, typically lands between 50 and 70% purity and still carries truncation products, deletion sequences, and residual protecting groups. Research grade or “purified” peptide has gone through at least one chromatographic cleanup and usually falls in the 80 to 95% range. High purity or ultra pure material, cleaned through repeated preparative HPLC passes, reaches 98% or higher, which is the tier most synthetic peptide suppliers advertise for catalog products.
Achievable purity isn’t just a function of how much purification you’re willing to pay for. Sequence length matters a great deal: longer chains accumulate more deletion and truncation byproducts during solid-phase synthesis, so a 30-mer is harder to push past 95% than a 10-mer. Hydrophobic stretches and aggregation-prone sequences also complicate purification because they tend to co-elute with closely related impurities, and post-translational modifications like phosphorylation or glycosylation add further separation challenges.
When a batch arrives at crude purity, a few paths are standard before you commit to full preparative purification:
- Desalting to remove small-molecule contaminants and reaction byproducts before further analysis.
- Analytical HPLC to check whether the main peak is separable enough to justify preparative runs.
- Preparative HPLC purification when the application demands research grade or higher.
- Re-synthesis when truncation products dominate the chromatogram, since no amount of purification fixes a poorly built backbone.
The decision to re-synthesize rather than purify harder usually comes down to yield economics: pushing a difficult sequence from 70% to 98% purity can mean losing most of the crude mass to purification waste.
How peptide purity is measured: area percent, mass balance, and orthogonal methods
Most certificates of analysis report purity as HPLC or UPLC area percent, meaning the main peak’s area divided by the total area of all detected peaks under UV detection. It’s the industry default because it’s fast, cheap, and reproducible across batches, but it only tells you what absorbs UV light at the wavelength used. Impurities that don’t absorb at that wavelength, or that co-elute with the main peak, simply don’t show up in the number.
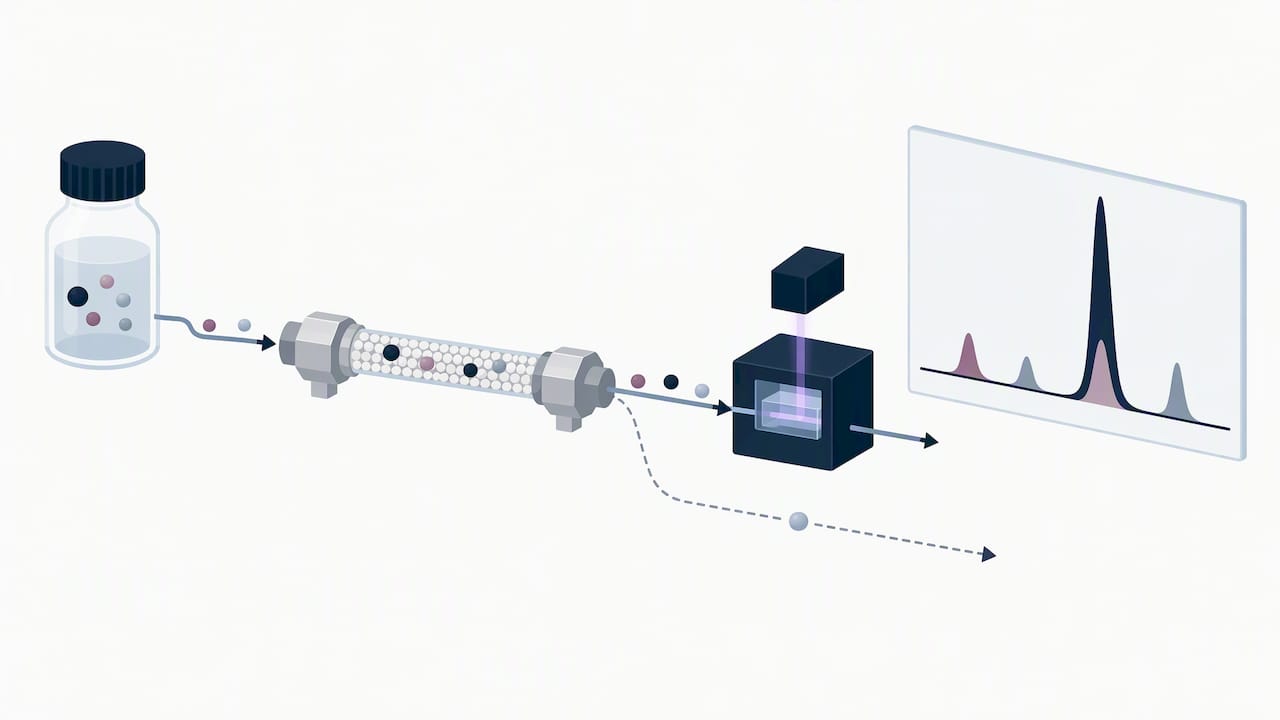
That gap is why LC-MS and tandem MS/MS matter as a complement rather than a substitute. Mass spectrometry identifies what’s actually in a given peak by mass, which catches co-eluting species that look like a single clean peak under UV but are actually two or more compounds with similar retention times and different masses.
The more rigorous alternative is a mass-balance approach, which treats purity as what’s left after you’ve measured and subtracted everything that isn’t the target peptide:
- Karl Fischer titration quantifies residual water content.
- Ion chromatography measures residual trifluoroacetic acid from synthesis and purification.
- ICP-MS detects and quantifies inorganic residues and trace metals.
- Amino acid analysis or quantitative NMR assigns the peptide content itself against a reference.
This is the approach the BIPM’s organic analysis work describes as the preferred route to absolute purity assignment, precisely because chromatographic area percent can be inflated by impurities that are either UV-transparent or hidden under the main peak. A peer-reviewed mass-balance study of synthetic glucagon found that a manufacturer’s reported LC-UV purity of 98.37% dropped to 89.636% once mass balance accounted for water, TFA, and inorganic content, a gap of nearly nine percentage points between the chromatographic figure and the traceable mass-fraction value (Scientific Reports).
Orthogonal structure confirmation, typically 1D and 2D NMR alongside high-resolution mass spec, fills in what chromatography and mass balance alone can’t: it confirms the molecule is actually the sequence you ordered, not just a compound of the right mass and approximate retention time.
Pro Tip: Never treat a single LC-UV area percent number as the final word on purity; ask whether mass balance or MS confirmation backs it up.
Regulatory thresholds for reporting and qualifying impurities
Pharmacopeial and regulatory frameworks set specific thresholds for when an impurity needs to be reported, identified, or formally qualified with safety data. Health Canada’s quality guidance for new drug submissions generally accepts the Ph. Eur. Recommendations for synthetic peptides, which set out three tiers.
- A reporting threshold of approximately 0.1%, above which any impurity must appear on the batch analysis, according to Health Canada guidance.
- An identification threshold near 0.5%, requiring structural confirmation of what the impurity actually is.
- A qualification threshold around 1.0%, requiring safety data before the impurity can be accepted at that level.
These aren’t arbitrary cutoffs. Health Canada’s guidance frames acceptance criteria as something that should be justified by the specific peptide’s intended use, dose, and the batch data actually generated during development, not applied as a blanket rule across unrelated products. For a lab sourcing material for in vivo work, that means asking a supplier for numeric batch data rather than accepting a vague claim of “high purity” with no supporting figures.
Reading a certificate of analysis and understanding reference standards
A CoA is only as useful as what it discloses. At minimum, check for the analytical method used (and its parameters), the assay result with units, the actual chromatogram rather than just a summary number, and mass spectrometry data confirming identity. For rigorous work, also look for water content, residual TFA, and inorganic residue figures, since these feed directly into any mass-balance recalculation you might want to do yourself.
- Reported method and run conditions (column, gradient, detection wavelength).
- Assay value with units and the raw chromatogram, not just a final percentage.
- Mass spec data confirming the molecule’s identity.
- Water, TFA, and inorganic residue figures where mass balance is claimed.
- Lot number and stability or storage data.
Reference standards underpin all of this. A primary reference standard is independently characterized, ideally through mass-balance assignment, and serves as the traceable anchor against which secondary (working) standards are calibrated. Health Canada’s related quality guidance expects primary standards to carry full characterization data, with secondary standards documented against them. If a CoA lacks this detail, it’s reasonable to ask the supplier directly for the underlying chromatogram, MS spectrum, and the reference standard’s provenance before relying on the stated number.
Choosing purity for your experiment and verifying it quickly
Matching purity to application saves both money and false leads in your data.
- Early screening and hit identification can often tolerate 80 to 90% purity, since you’re filtering candidates, not drawing final conclusions.
- Cell-based assays generally call for 95% or higher, because impurities can introduce confounding biological activity.
- In vivo work usually warrants 98% or above, where impurities could affect dosing accuracy or introduce unexpected effects.
- NMR reference work or use as an analytical standard demands the highest tier available, ideally with mass-balance-assigned purity, since the standard’s accuracy limits everything measured against it.
On the other hand, running an in vivo study on 90% material invites variability you’ll spend more time troubleshooting than you saved on the purchase.
Before committing to an expensive batch, a few quick checks catch most problems: request the raw chromatogram rather than a summary figure, ask for the MS spectrum confirming identity, and check whether water and TFA content are reported if mass balance matters for your application. For a broader checklist, see our guide to what buyers should check before purchasing peptides.
Pro Tip: If a supplier can’t produce a raw chromatogram on request, treat the stated purity number with caution regardless of what it says.
Our quality standards and the documentation we provide
We formulate our peptides to exceed 99% purity through advanced purification methods, and we back that with the testing practices described on our purity and quality standards page. We provide compounds aimed at giving researchers and individual customers measurable effectiveness and confidence in what they’re using.
When evaluating any supplier, including us, the documentation worth requesting is consistent: a certificate of analysis, the underlying chromatogram, mass spectrometry data confirming identity, and a description of the reference standard used for calibration. We make supporting detail available alongside our product listings rather than leaving purity as an unverified claim.
Why the purity number on the label isn’t the whole story
The most common mistake in this space is treating a single HPLC area percent figure as a complete answer. It’s a useful, fast screening number, but it answers a narrower question than most people assume: how clean is the main UV-absorbing peak relative to other UV-absorbing peaks, not how much of the vial’s actual mass is your target peptide.
Conventional advice leans hard on purity percentage as a single axis of quality, when sequence confirmation and impurity identification often matter more for a given experiment.
If there’s one habit worth adopting, it’s asking suppliers what’s behind the number rather than comparing purity figures in isolation. A chromatogram, a mass spectrum, and a reference standard description tell you more about whether a peptide will behave predictably in your system than a single percentage ever will.
— Pure Peptide
Sourcing high purity peptides and what to request before you order
We supply research-grade and ultra-pure peptides across weight loss, muscle growth, recovery, anti-aging, and libido categories, alongside anti-aging peptides frequently used in cosmetics and reconstitution ancillaries. Before ordering, ask for the certificate of analysis, raw chromatogram, and mass spectrometry data so you can verify purity claims yourself rather than taking a label at face value. Browse our peptides for muscle or full catalogue to see current documentation alongside each listing.
FAQ
What is a good purity level for peptides?
Crude peptide in the 50 to 70% range is generally reserved for early screening, not for experiments where impurities could confound results.
Is 98% purity good for a peptide?
It’s worth checking whether that figure comes from chromatographic area percent alone or is supported by mass-balance or MS data, since the two methods can disagree meaningfully, as shown in a mass-balance study of synthetic glucagon.
What are the top 3 peptides?
There’s no single ranked list of “top” peptides, since the right choice depends entirely on the research goal, whether that’s metabolic research, recovery, or anti-aging work. We offer peptides across several of these categories, including options for weight loss and muscle growth, each suited to different applications.
How to tell if peptides are good quality?
Check the certificate of analysis for the actual chromatogram, mass spectrometry identity confirmation, and ideally water and TFA content rather than relying on a single stated purity percentage. A supplier willing to share raw analytical data, not just a summary number, is a stronger signal of quality than the percentage alone.
How is peptide purity actually measured in a lab?
Purity is most commonly measured by HPLC or UPLC area percent under UV detection, often supplemented with LC-MS for impurity identification. For traceable, absolute purity, mass balance combines water content, residual TFA, inorganic residues, and amino acid analysis or quantitative NMR, as outlined in BIPM’s guidance on large organics.